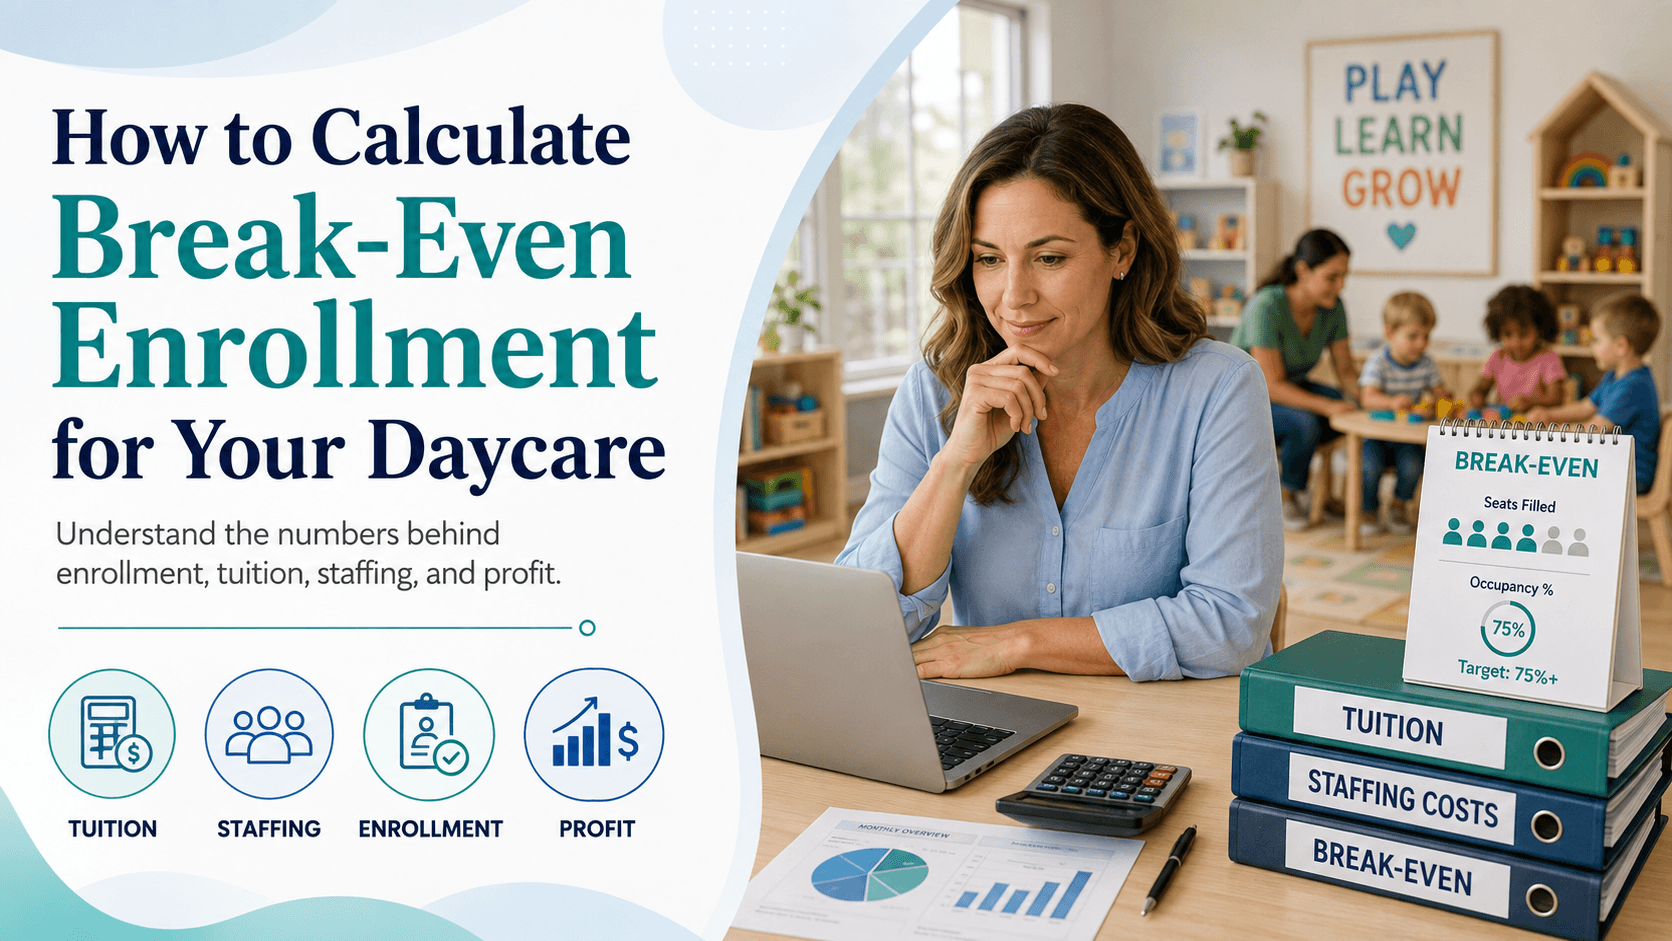
How to Calculate Break-Even Enrollment for Your Daycare

Your daycare is licensed for 100 children.
You currently have 82 enrolled.
Is that good?
Maybe.
An 82% enrollment rate could produce a healthy profit in one childcare center and a monthly loss in another.
The number of children enrolled tells you how full the center is.
It does not tell you whether the center is financially sustainable.
For that, you need to know your break-even enrollment.
Break-even enrollment is the approximate number of enrolled children—or amount of tuition revenue—you need to cover the costs of operating your childcare business before generating a profit.
Once you know that number, many important business decisions become easier.
You can better evaluate:
- Whether current enrollment is sufficient
- Whether tuition rates are appropriate
- Whether a classroom is financially viable
- Whether you can afford another employee
- Whether a discount is actually affordable
- Whether expanding capacity makes financial sense
- How many enrollments a new location needs before it can support itself
- How much enrollment loss your center can absorb
- When growth begins producing real profit
For childcare owners, break-even analysis turns enrollment from a simple headcount into a financial management tool.
What Does Break-Even Mean for a Daycare?
At the break-even point:
Total revenue = Total costs
The daycare is generating enough money to pay its expenses, but it is not yet producing meaningful profit.
The U.S. Small Business Administration describes the break-even point as the level where total cost and total revenue are equal. The standard calculation looks at fixed costs, selling price, and variable cost per unit.
For a childcare center, however, the “unit” is not a manufactured product.
It may be:
- One enrolled child
- One classroom seat
- One full-time equivalent enrollment
- One program
- One classroom
- One location
That is what makes daycare break-even analysis more interesting.
A center does not simply need to know:
How many children are enrolled?
It needs to know:
How much revenue does each enrolled child contribute toward covering the costs of operating the center?
Why Licensed Capacity Is Not Your Break-Even Point
Suppose your childcare center is licensed for 120 children.
That does not mean you need 120 children to break even.
You may break even at:
- 72 children
- 84 children
- 96 children
The answer depends on your:
- Tuition rates
- Age mix
- Payroll
- Rent
- Staffing model
- Food costs
- Subsidy reimbursement rates
- Insurance
- Debt
- Administrative overhead
- Other operating expenses
Two centers with the same licensed capacity can have completely different break-even points.
Center A
Licensed capacity: 100 children
Average monthly revenue per child: $1,500
Monthly operating costs: $110,000
Center B
Licensed capacity: 100 children
Average monthly revenue per child: $1,150
Monthly operating costs: $110,000
Both centers have the same capacity.
Both have the same costs.
But Center B needs substantially more enrolled children to cover those costs because its average revenue per child is lower.
That is why capacity alone is not enough.
Start With Three Numbers
A basic break-even calculation requires three pieces of information:
- Fixed costs
- Revenue per enrollment
- Variable cost per enrollment
The standard formula is:
Break-Even Enrollment = Fixed Costs ÷ Contribution Margin per Child
And:
Contribution Margin per Child = Average Revenue per Child – Variable Cost per Child
The SBA uses the same general structure for break-even analysis:
Fixed Costs ÷ (Price – Variable Cost) = Break-Even Units
For childcare businesses, we adapt that formula to enrollment.
Step 1: Calculate Your Fixed Costs
Fixed costs are expenses that do not immediately change because one additional child enrolls or leaves.
Examples may include:
- Rent or mortgage-related facility cost
- Director salary
- Administrative salaries
- Base teacher payroll
- Insurance
- Accounting
- Software subscriptions
- Internet
- Security monitoring
- Licensing costs
- Professional services
- Loan interest
- Certain utilities
- Office expenses
- Marketing commitments
You may pay these costs whether 60 or 70 children attend.
Example
Suppose your monthly fixed costs look like this:
Facility cost: $18,000
Base payroll and administration: $55,000
Insurance: $3,500
Software and technology: $1,500
Utilities: $4,000
Professional services: $2,000
Marketing: $2,000
Other fixed overhead: $4,000
Total fixed costs: $90,000 per month
That gives us the first number needed for the calculation.
Step 2: Calculate Average Revenue per Child
This sounds easy.
Take total tuition and divide it by enrollment.
But childcare businesses often have several tuition rates.
You may charge different amounts for:
- Infants
- Toddlers
- Preschool
- Pre-K
- School-age care
- Before-school care
- After-school care
- Part-time enrollment
- Full-time enrollment
You may also receive:
- Private-pay tuition
- Subsidy payments
- Parent copayments
- Registration fees
- Activity fees
- Other program revenue
Because of this, using the tuition rate displayed on your website may not give you an accurate average.
Use actual collected or earned revenue
Suppose your center has:
80 enrolled children
And monthly childcare-related revenue is:
$120,000
Your average monthly revenue per enrolled child is approximately:
$120,000 ÷ 80 = $1,500
That is more useful than assuming every child pays the same published tuition rate.
Step 3: Estimate Variable Cost per Child
Variable costs generally increase as enrollment increases.
For childcare businesses, examples may include:
- Food
- Classroom consumables
- Diapers or personal-care supplies provided by the center
- Art materials
- Activity supplies
- Certain payment-processing fees
- Enrollment-related materials
- Some field-trip expenses
Suppose these costs average:
$150 per enrolled child per month
If average revenue is $1,500 per child, then:
$1,500 revenue – $150 variable cost = $1,350 contribution margin
Each enrolled child contributes approximately $1,350 toward fixed operating costs and eventual profit.
Step 4: Calculate Basic Break-Even Enrollment
Now use:
Fixed Costs ÷ Contribution Margin per Child
Using our example:
$90,000 ÷ $1,350 = 66.7
The daycare needs approximately:
67 enrolled children
to cover those estimated costs.
If the center is licensed for 100 children, basic break-even occupancy is approximately:
67%
That gives the owner an extremely useful benchmark.
Below 67 enrollments, the center may be losing money under these assumptions.
Around 67, it is approximately breaking even.
Above 67, additional contribution begins moving toward profit.
But Daycare Break-Even Is More Complicated Than a Normal Business
The basic formula is useful.
But childcare has one major complication:
Payroll does not behave like a perfectly fixed or perfectly variable expense.
Staffing often changes in steps.
This matters enormously.
Childcare centers are commonly subject to state or territorial licensing requirements, and staffing requirements differ by jurisdiction and program type.
That means adding one additional child may sometimes require almost no additional payroll.
But another additional child may require an entirely new employee.
This creates what we can call staffing cliffs.
Understanding the Staffing Cliff
Imagine a classroom currently has:
19 children
The existing staffing schedule can accommodate those children under the center’s applicable requirements and operating model.
One additional enrollment may change staffing requirements.
Suddenly, enrollment #20 is not simply:
+$1,500 revenue
It may also create:
+$3,500 or $4,500 of monthly payroll-related cost
depending on the staffing situation.
The economics of that enrollment are completely different.
This is why daycare break-even analysis should eventually move beyond a simple whole-center average.
You should analyze:
- Center-wide break-even
- Classroom break-even
- Staffing thresholds
- Revenue by age group
The Most Important Question: What Happens When One More Child Enrolls?
For each classroom, ask:
If we enroll one more child tomorrow, what additional costs appear?
Sometimes the answer is:
- Food
- Supplies
- Payment fees
That child may be highly profitable.
Other times the answer is:
- Another teacher
- Additional payroll taxes
- Benefits
- Training
- Background checks
- Supplies
That child may temporarily reduce classroom profitability until several more seats are filled.
This is why enrollment should be evaluated in groups, not only one child at a time.
Example: The Classroom Staffing Cliff
Suppose a preschool classroom produces:
Average tuition per child: $1,400 per month
Variable cost per child: $125
Contribution before additional staffing:
$1,275 per child
The classroom currently has 14 children.
Adding children 15 through 18 may not require another scheduled staff position under the center’s applicable staffing plan.
Those four children could contribute approximately:
4 × $1,275 = $5,100 per month
before considering other costs.
Now suppose enrollment #19 requires another teacher.
That teacher costs the center approximately:
- Wages: $3,600
- Employer payroll taxes: $350
- Benefits and other payroll-related cost: $450
Total:
$4,400 per month
Enrollment #19 contributes roughly $1,275 but triggers $4,400 of additional payroll.
On that child alone, the decision looks terrible.
But that is not the correct analysis.
If adding the teacher creates capacity for six additional enrollments, then the correct question is:
How many of those new seats must be filled before the additional staffing becomes profitable?
Calculate the Break-Even Point for an Additional Teacher
Additional monthly teacher cost:
$4,400
Contribution margin per additional child:
$1,275
Calculation:
$4,400 ÷ $1,275 = 3.45
You need approximately:
4 additional children
to cover the incremental cost of that teacher.
After that point, additional enrollments create stronger incremental profit.
That is a much more useful staffing decision than simply asking:
“Can we afford another teacher?”
The better question is:
“How many additional enrollments must this position support?”
Break-Even Enrollment by Classroom
Whole-center break-even tells you whether the business is financially sustainable overall.
Classroom-level break-even tells you where the profit is coming from.
A childcare center may have:
- A highly profitable toddler room
- A moderately profitable preschool room
- An infant room barely covering costs
- A school-age program losing money
When all financial activity is combined into one total, these differences disappear.
Example: Three Classrooms
Infant Classroom
10 enrolled children
Monthly revenue: $20,000
Direct staffing: $14,000
Food/supplies: $1,500
Allocated facility and overhead: $4,000
Approximate classroom contribution:
$500
Toddler Classroom
16 enrolled children
Monthly revenue: $26,000
Direct staffing: $13,000
Food/supplies: $2,000
Allocated overhead: $4,000
Approximate classroom contribution:
$7,000
Preschool Classroom
20 enrolled children
Monthly revenue: $28,000
Direct staffing: $12,000
Food/supplies: $2,000
Allocated overhead: $4,000
Approximate classroom contribution:
$10,000
The center is profitable overall.
But each classroom contributes very differently.
Without classroom-level analysis, the owner may never realize how dependent the business is on the toddler and preschool programs.
Infant Care Often Requires Separate Analysis
Do not assume every enrollment has equal financial value.
Different age groups may have:
- Different tuition rates
- Different staffing needs
- Different room capacities
- Different supply costs
- Different demand
- Different subsidy reimbursement levels
An infant may generate higher tuition than a preschool child.
But the infant classroom may also require substantially more staffing per available seat under applicable licensing and operating requirements.
Therefore:
Higher tuition does not automatically mean higher profit.
The relevant measure is contribution after the costs required to provide that care.
Calculate Break-Even Revenue Too
Enrollment is not the only useful break-even measure.
You can also calculate break-even revenue.
The SBA’s standard sales-dollar approach uses:
Break-Even Revenue = Fixed Costs ÷ Contribution Margin Ratio
Suppose:
Monthly revenue: $150,000
Variable costs: $15,000
Contribution margin:
$135,000
Contribution margin ratio:
$135,000 ÷ $150,000 = 90%
Fixed costs:
$100,000
Break-even revenue:
$100,000 ÷ 0.90 = approximately $111,111
The center therefore needs approximately $111,111 of monthly revenue to cover the assumed cost structure.
This can be useful when tuition rates vary significantly and a simple headcount does not tell the whole story.
Break-Even Enrollment Should Use Full-Time Equivalents When Necessary
Suppose you have:
- 50 full-time children
- 20 children attending three days per week
- 15 children attending two days per week
Your enrollment system may show:
85 children
But those 85 enrollments do not produce the revenue of 85 full-time seats.
Using raw headcount may therefore exaggerate occupancy.
A better metric may be full-time equivalent enrollment, or FTE enrollment.
For example:
A five-day child = 1.0 FTE
A three-day child ≈ 0.6 FTE
A two-day child ≈ 0.4 FTE
The exact model should reflect your tuition and scheduling structure.
If the 85 children above convert to approximately 68 full-time equivalent seats, your economic occupancy is closer to 68 than 85.
This distinction becomes important when evaluating capacity and profitability.
Subsidy Enrollment Should Be Included Using Actual Economics
Subsidized childcare can be a valuable and important part of a center’s enrollment.
But do not evaluate subsidy seats only by comparing the published private-pay tuition rate with the reimbursement rate.
You should understand the total economics.
Consider:
- Reimbursement amount
- Parent copayment
- Attendance rules
- Payment timing
- Administrative requirements
- Collection risk
- Age group
- Staffing requirement
- Vacancy risk
Suppose:
Private-pay tuition = $1,500
Subsidy reimbursement + parent responsibility = $1,400
The difference is only $100.
If the subsidized seat improves stable occupancy and collections, it could still be financially attractive.
The correct question is:
What contribution does the seat produce after the costs and collection realities are considered?
Tuition Discounts Change Your Break-Even Point
Discounts feel small when viewed one family at a time.
Across the center, they can materially affect break-even enrollment.
Common discounts include:
- Sibling discounts
- Employee discounts
- Military discounts
- Annual-prepayment discounts
- Promotional rates
- Founding-family discounts
- Referral incentives
Suppose published tuition averages:
$1,500 per child
But after discounts, credits, and scholarships, actual average collected tuition is:
$1,410
That $90 difference matters.
Across 80 children:
$90 × 80 = $7,200 per month
or:
$86,400 per year
Your break-even analysis should use realized revenue, not merely your tuition sheet.
Enrollment Is Not the Same as Collected Revenue
A center may have 95% enrollment and still struggle financially if families are not paying consistently.
For example:
Licensed capacity: 100
Enrolled: 95
Looks excellent.
But suppose:
- Five families are significantly past due.
- Several subsidy reimbursements are delayed.
- Three accounts have failed payments.
- Multiple families have large credits.
Operational enrollment may be 95%.
Economic collection may be materially lower.
Monitor:
- Enrollment
- Billing
- Collections
- Accounts receivable
- Failed payments
- Aging balances
A filled seat that is not generating collectible revenue is not financially equivalent to a paid seat.
Break-Even Occupancy Is One of the Most Useful Daycare KPIs
Once you calculate break-even enrollment, convert it into an occupancy percentage.
Suppose:
Licensed usable capacity: 100
Break-even enrollment: 67
Break-even occupancy:
67%
Current enrollment:
82
Current occupancy:
82%
Margin above break-even:
15 enrollment points
This tells you something much more useful than simply saying:
“We are 82% full.”
You know the center has some cushion above break-even.
Create a Break-Even Safety Margin
A business should not aim merely to stay one enrollment above break-even.
You need a safety margin.
Suppose your break-even point is 67 children.
If enrollment is 69, the daycare is technically above break-even.
But two families leaving could eliminate the profit.
That is not much financial protection.
Calculate your enrollment safety margin
Current enrollment:
82
Break-even enrollment:
67
Safety margin:
15 children
You can also calculate:
(Current Enrollment – Break-Even Enrollment) ÷ Current Enrollment
That shows how much enrollment could potentially decline before reaching break-even, assuming the cost structure remained unchanged.
The larger the margin, the more financial flexibility the center generally has.
Know the Difference Between Break-Even and Target Profit
Breaking even should not be the goal of a healthy childcare business.
If you merely break even:
- There is little return for ownership.
- There is limited money for reinvestment.
- There is less capacity to handle emergencies.
- Equipment replacement becomes difficult.
- Expansion becomes harder.
- A short enrollment decline can create losses.
You need a target-profit enrollment too.
How to Calculate Enrollment Needed for a Target Profit
Suppose:
Fixed monthly costs: $90,000
Target monthly profit: $20,000
Contribution per child: $1,350
Formula:
(Fixed Costs + Target Profit) ÷ Contribution Margin per Child
Calculation:
($90,000 + $20,000) ÷ $1,350 = 81.5
You would need approximately:
82 enrolled children
to generate the desired $20,000 monthly profit under these assumptions.
Now your enrollment targets become much more meaningful:
- 67 children: approximately break-even
- 75 children: profitable but below target
- 82 children: target-profit enrollment
- 90 children: stronger profitability
- 100 children: maximum modeled enrollment
That is useful information for the director, owner, marketing team, and financial adviser.
Your Marketing Budget Should Know the Break-Even Number
Marketing should not operate separately from financial planning.
Suppose you have 12 open seats.
Before spending aggressively to fill them, identify:
- Which classrooms have the openings?
- What tuition does each seat generate?
- Will additional teachers be required?
- What is the contribution margin?
- Which seats are above or below classroom break-even?
Imagine your preschool room has five open seats that can be filled without adding another employee.
Those seats may be financially valuable.
Your infant room may have one available seat that immediately triggers a staffing change.
The marketing priority may therefore be:
Fill the preschool seats first.
That is an example of accounting informing marketing strategy.
Break-Even Analysis Can Help With Tuition Pricing
Many childcare owners price tuition by checking what nearby centers charge.
Competitor pricing is useful.
But it should not determine your tuition by itself.
Your competitors may have:
- Lower rent
- Older leases
- Different wages
- Different benefits
- Different debt
- Different classroom layouts
- Different enrollment
- Different profit expectations
A competitor can charge $1,300 and survive.
Your center may need $1,500 to produce the same financial result.
Start with your costs
Before setting tuition, understand:
- Fixed costs
- Variable costs
- Staffing
- Usable capacity
- Desired operating profit
- Expected occupancy
Then evaluate the market.
Pricing should reflect both:
What families are willing to pay
and
What the business needs to charge to remain financially healthy.
Example: How a Tuition Increase Changes Break-Even Enrollment
Suppose:
Fixed costs: $100,000
Variable cost per child: $150
Average tuition: $1,400
Contribution per child:
$1,250
Break-even enrollment:
$100,000 ÷ $1,250 = 80 children
Now suppose average tuition increases to:
$1,500
Contribution becomes:
$1,350
New break-even enrollment:
$100,000 ÷ $1,350 = approximately 74 children
A $100 increase in average tuition reduces the modeled break-even requirement from approximately:
80 children to 74 children
That is a meaningful change.
However, the analysis is incomplete unless you also consider:
- Family response
- Local market pricing
- Potential enrollment loss
- Discounts
- Subsidy rates
- Competitive positioning
A tuition increase is not automatically good simply because the spreadsheet improves.
Example: How a Wage Increase Changes Break-Even Enrollment
Now consider the opposite.
Current fixed operating costs:
$100,000
Contribution per child:
$1,350
Break-even:
74 children
Suppose wage adjustments increase monthly payroll by:
$8,000
New fixed cost:
$108,000
New break-even:
$108,000 ÷ $1,350 = 80 children
Without changing tuition, the center now needs approximately six additional children just to reach the same break-even position.
This illustrates why tuition and payroll decisions should be modeled together.
Do Not Cut Payroll Blindly to Improve the Formula
When owners discover that payroll is the largest cost, the immediate temptation may be:
We need fewer employees.
That can be dangerous.
Childcare staffing is connected to:
- Licensing requirements
- Safety
- Quality
- Employee workload
- Hours of operation
- Parent experience
- Staff retention
The objective is not simply to minimize payroll.
The objective is to create an efficient staffing structure that safely supports enrollment and the program’s requirements.
Instead of asking:
“How do we cut payroll?”
Ask:
- Are schedules aligned with actual attendance?
- Are we paying unnecessary overtime?
- Are classrooms staffed efficiently throughout the day?
- Are opening and closing shifts structured properly?
- Are administrative roles appropriate for the center’s size?
- Are we carrying excess staff because enrollment declined?
- Would adding enrollment improve staffing efficiency?
Good financial management protects both profitability and service quality.
Use Break-Even Analysis Before Opening a New Classroom
Suppose you are considering opening another classroom.
Do not begin with:
“We have space, so let’s open it.”
Model the economics first.
New classroom costs
Teacher payroll: $10,000
Additional payroll taxes/benefits: $1,500
Supplies and food: $1,500
Allocated facility and overhead: $2,000
Additional administrative/other cost: $1,000
Total approximate cost:
$16,000 per month
Average contribution per child:
$1,250
Break-even enrollment:
$16,000 ÷ $1,250 = 12.8
The classroom may need approximately:
13 children
before reaching break-even under that model.
If the classroom holds 18 children, the economics may look attractive.
But if expected demand is only six or seven children for the next year, opening immediately may create a sustained loss.
Use Break-Even Analysis Before Opening Another Location
A new center requires a more detailed model.
Before signing a lease, estimate:
Fixed operating costs
- Rent
- Director payroll
- Core teaching payroll
- Insurance
- Utilities
- Software
- Licensing
- Debt
- Administrative costs
Variable costs
- Food
- Classroom materials
- Payment fees
- Program supplies
Startup costs
- Deposit
- Construction
- Furniture
- Playground
- Security
- Technology
- Licensing
- Marketing
Enrollment assumptions
Model:
- Month 1
- Month 3
- Month 6
- Month 12
Do not assume the center opens at 90% occupancy.
Ask:
How much cash is required to survive until the new location reaches break-even enrollment?
That is a much safer expansion question.
Daycare AccountingPRO’s On-Demand CFO service specifically includes budgeting, cash-flow forecasting, pricing and profit-margin analysis, growth planning, and financial modeling—exactly the types of analysis needed for decisions like these.
Your Break-Even Point Changes
Do not calculate this number once and keep it forever.
Your daycare break-even enrollment changes when:
- Tuition changes
- Wages increase
- Rent increases
- Insurance renews
- Benefits change
- Subsidy rates change
- A loan begins or ends
- Enrollment mix changes
- A director is hired
- A classroom opens
- Hours expand
- A location is added
At minimum, review the calculation during the annual budgeting process.
For growing centers, quarterly review may be more useful.
Build Three Enrollment Scenarios
Instead of forecasting one number, create three scenarios.
Scenario 1: Conservative
Enrollment: 70 children
Ask:
- Can we still cover payroll?
- Are we profitable?
- What happens to cash?
- What costs could adjust?
Scenario 2: Expected
Enrollment: 82 children
Ask:
- What profit should we expect?
- How much cash should accumulate?
- How much tax should be reserved?
Scenario 3: Strong
Enrollment: 95 children
Ask:
- Will staffing need to increase?
- Does the current facility support this?
- How much additional profit is generated?
- Will another administrative role be needed?
Scenario planning prevents owners from assuming every additional enrollment creates the same amount of profit.
The Numbers You Need From Your Bookkeeping
Accurate break-even analysis depends on accurate books.
Your accounting system should clearly identify:
Revenue
- Private-pay tuition
- Subsidy revenue
- Parent copayments
- Registration fees
- Activity fees
- Other program revenue
Payroll
- Teacher wages
- Management wages
- Administrative payroll
- Employer payroll taxes
- Benefits
- Overtime
- Substitute staffing
Direct program costs
- Food
- Classroom supplies
- Educational materials
- Cleaning
- Program-specific costs
Overhead
- Facility cost
- Insurance
- Utilities
- Software
- Professional services
- Marketing
- Interest
- Administrative expenses
Daycare AccountingPRO’s childcare bookkeeping service is designed around childcare-specific categories such as tuition, payroll, food programs, supplies, and licensing, which makes this type of financial analysis more useful than relying on broad generic bookkeeping categories.
A Monthly Break-Even Dashboard for Daycare Owners
You do not need to repeat a complicated analysis every week.
Create a simple dashboard containing:
Licensed/usable capacity
Current enrollment
Full-time equivalent enrollment
Occupancy percentage
Break-even enrollment
Target-profit enrollment
Average revenue per child
Payroll as a percentage of revenue
Monthly profit
Cash balance
Accounts receivable
Open seats by classroom
Then compare each month.
You will start seeing patterns that a bank balance alone cannot show.
Warning Signs Your Enrollment Is Not Producing Enough Profit
Pay attention if:
- Enrollment is high but profit remains low.
- Tuition increases but cash does not improve.
- Payroll rises faster than revenue.
- Certain classrooms are always below capacity.
- The center regularly needs loans despite strong enrollment.
- Owner distributions depend on unusually strong months.
- One enrollment loss immediately creates cash stress.
- Marketing fills seats but profit barely changes.
- You cannot identify which classrooms are profitable.
- You do not know the center’s break-even enrollment.
These signs do not necessarily mean the business is failing.
They mean enrollment may not yet be connected to financial strategy.
Quick Daycare Break-Even Checklist
Before calculating your break-even enrollment, confirm:
- Monthly bookkeeping is current.
- Bank and credit-card accounts are reconciled.
- Tuition revenue is accurate.
- Subsidy revenue is separated.
- Discounts and credits are reflected.
- Payroll is reconciled.
- Employer payroll costs are included.
- Fixed costs are identified.
- Variable costs are estimated.
- Staffing thresholds are understood.
- Classroom capacities are accurate.
- Part-time enrollment is converted appropriately.
- Accounts receivable has been reviewed.
- Break-even enrollment has been calculated.
- Target-profit enrollment has been calculated.
- Each classroom has been reviewed separately where practical.
- Expansion decisions are modeled before commitments are made.
Do Not Manage Your Daycare by Enrollment Alone
Enrollment is important.
But enrollment without financial context can be misleading.
A center that is 90% full may be less profitable than one that is 75% full.
A classroom with the highest tuition may have the weakest margin.
A new teacher may initially reduce profit but create enough capacity to become highly profitable once additional seats are filled.
A tuition increase may reduce the number of children required to break even.
A new location may look exciting while requiring months of cash support before reaching sustainable occupancy.
That is why childcare owners need more than enrollment reports.
They need to understand the economics behind each seat.
Know the Enrollment Number That Actually Matters
Ask yourself:
How many children does my daycare need to cover its costs?
Then ask:
How many children do we need to produce the profit we actually want?
Those are two different numbers.
Knowing both can change how you make decisions about:
- Tuition
- Staffing
- Marketing
- Discounts
- Classroom openings
- Expansion
- Cash reserves
- Owner compensation
Your goal should not simply be to fill every available seat.
Your goal should be to build a childcare business where enrollment produces sustainable profit, adequate cash flow, reliable staffing, and enough financial strength to support the owner and the children and families the business serves.
Daycare AccountingPRO helps childcare business owners move beyond basic bookkeeping by connecting financial reports with pricing, cash flow, tax planning, profitability, and growth decisions.
If you do not know your daycare’s break-even enrollment—or you know your center is busy but are unsure which classrooms are actually producing profit—schedule a financial strategy consultation with Daycare AccountingPRO.
Understanding the number may change the way you run your childcare business.
This article is provided for general educational purposes and does not constitute individualized accounting, tax, legal, licensing, or financial advice. Childcare staffing and licensing requirements vary by jurisdiction. Financial calculations should be adapted to the specific facts of your business.